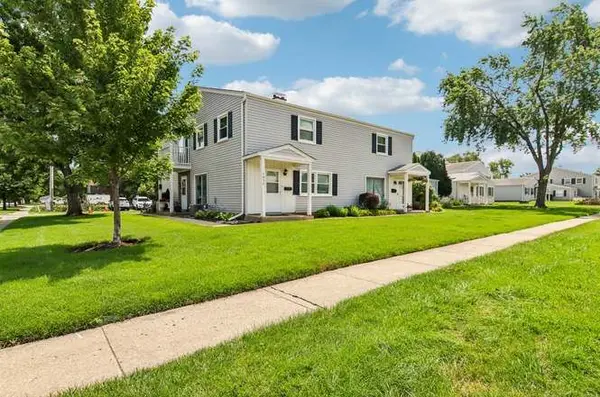
How Walkable is St. Charles, IL?
Along the Fox River west of Chicago, St. Charles near Chicago, IL pairs a historic downtown with a Walk Score of 37. That's car-dependent by the numbers, though the Main Street district offers pockets of walkability along the river.
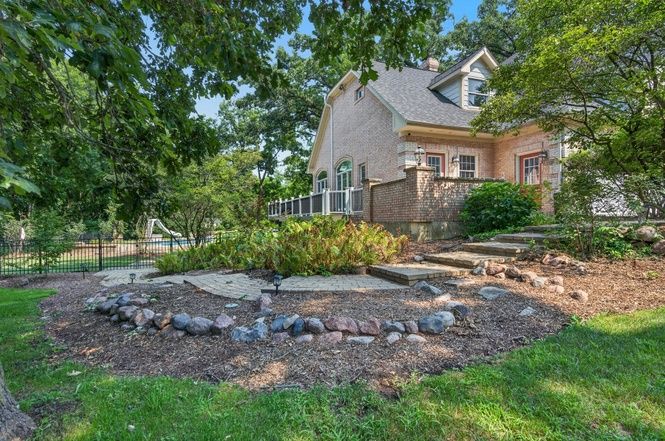
Walkability in the Chicago area
St. Charles' 37 falls below the metro average of 77 but matches Geneva (38) nearby and sits above Batavia (29). The Fox River Valley cities score similarly across the board, with walkability concentrated in their historic downtown strips.
The Metra commuter rail does not directly serve St. Charles, though stations in nearby Geneva and Elburn are accessible by car. Route 64 (Main Street) serves as both the commercial spine and the primary east-west corridor. The Fox River Trail provides a multi-use path for cycling and running along the river.
What a Walk Score of 37 means
St. Charles' Walk Score of 37 places it in the "Car-Dependent" category. Downtown residents can walk to restaurants and shops, but the city's overall layout requires driving for most errands. Transit options are minimal within the city. The bike score of 50 (Minimal Bike Infrastructure) is higher than many suburbs thanks to the Fox River Trail.
Why do buyers choose St. Charles?
St. Charles buyers value the Fox River corridor lifestyle. The median sale price of $454,772 is moderate for Kane County, sitting between Geneva ($558,720) above and Aurora ($364,817) below. About 54% of homes sell above asking, and listings move in 43 days. The market is down 2% year over year, creating some price softness relative to its neighbors.
Buyers here accept car dependence in exchange for river-adjacent living, a walkable downtown strip for weekend use, and a mid-range price point in the Kane County market. The nearest significantly more walkable option is Evanston (76), but that's a completely different geographic market. Within the Fox River corridor, walkability is fairly consistent and car-dependent everywhere, so buyers choose among these cities based on price and housing stock rather than pedestrian access.
| Location | Walk Score | Bike Score | Transit Score | Median sale price | Days on market |
|---|---|---|---|---|---|
| St. Charles | 37 | 50 | -- | $454,772 | 43 days |
| Mundelein | 38 | 49 | -- | $418,535 | 44 days |
| Geneva | 38 | 57 | -- | $558,720 | 42 days |
| Hoffman Estates | 35 | 55 | -- | $424,787 | 44 days |
| Roselle | 35 | 58 | 16 | $441,779 | 43 days |
| Tinley Park | 35 | 42 | -- | $331,084 | 44 days |
Limited to neighborhoods with at least 10 home sales in the period.
All data comes from Redfin and represents a three-month rolling average ending July 2026. This article has been generated, in whole or in part, using generative artificial intelligence (AI) technology, with input from Redfin head of economics research Chen Zhao. While efforts have been made to ensure the accuracy and reliability of this information, you should independently verify all data, facts, and citations contained in this article before relying on it for any purpose. This information is not a substitute for advice from a real estate agent, financial advisor, or other licensed professional. Check the Redfin Data Center for additional in-depth housing market data.
Categories
Recent Posts